Profily.me

Music dataviz

Role:

Lead Designer

Client:

Hetic

Type:

Social dataviz

Team :

Barbara JEANDEAU(Project Manager), Arthur GUILLERMIN HAZAN (Lead Designer), 
Hélène PRUVOT (d3.js developer),
Loic SAINT-ROCH (API developer), Charles TALBOT (Back-end developer), Loic PADOWSKI (Data analyst)

01.

The brief

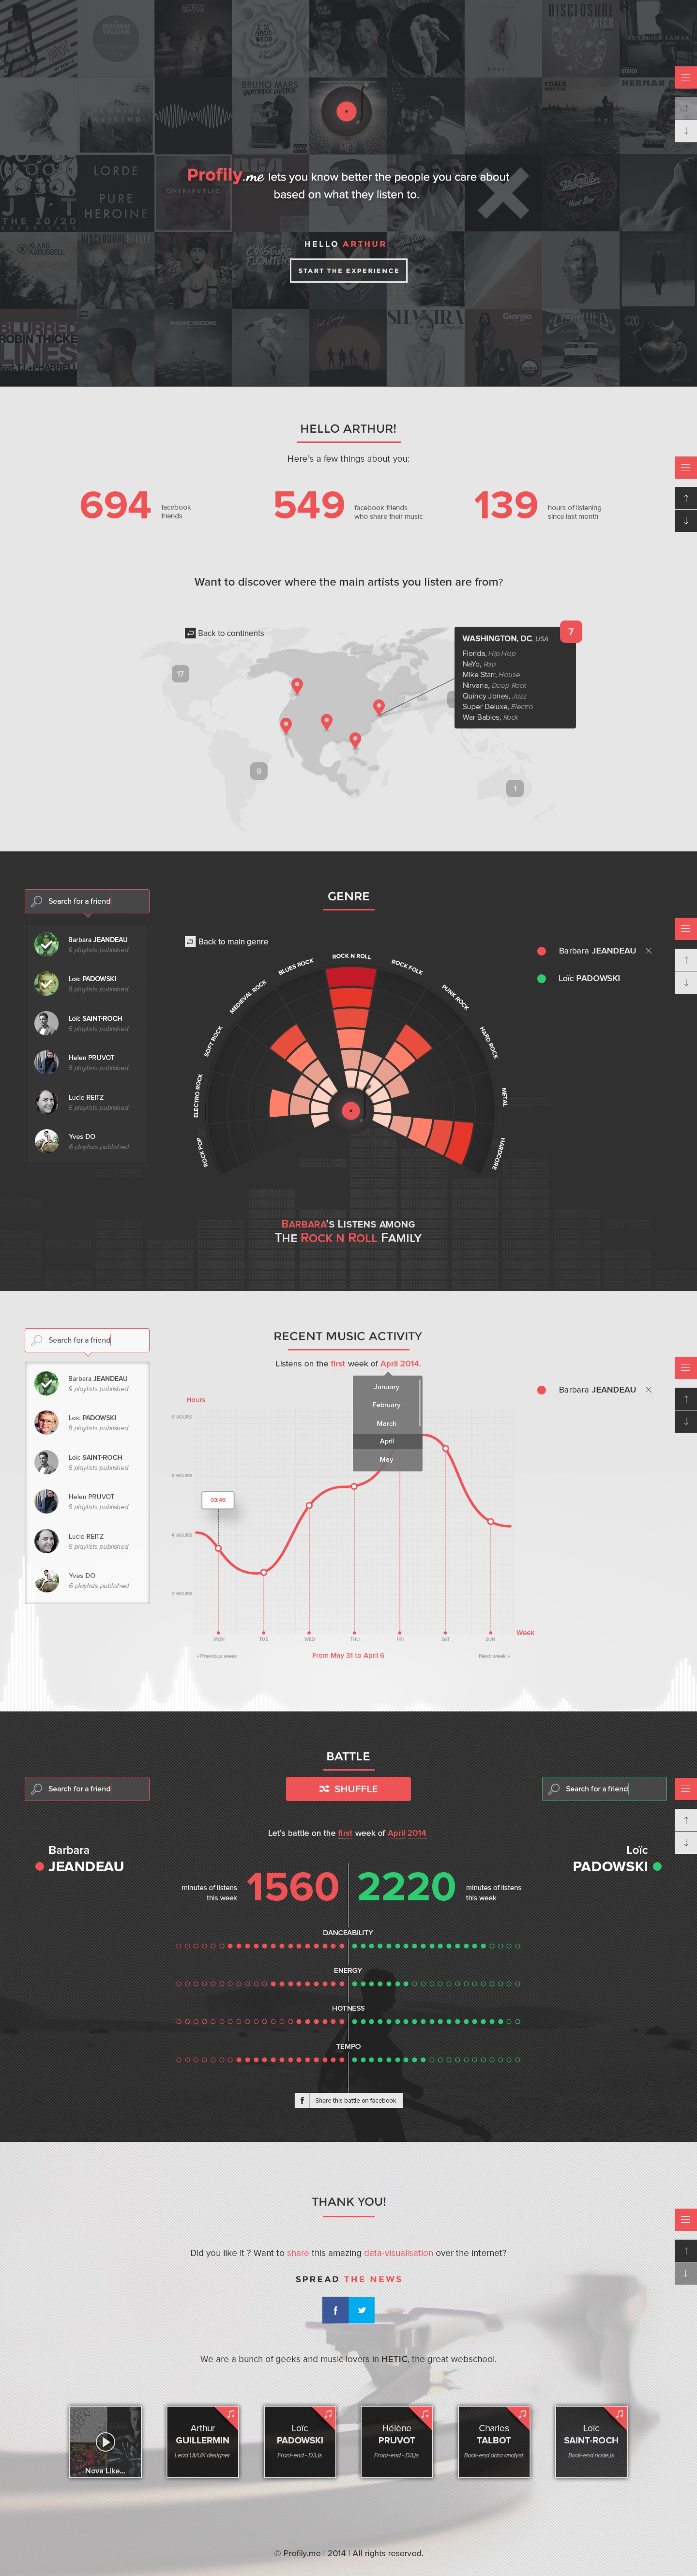
Profily.me is the result of a 3 weeks work in 3rd year at HETIC. The only brief we had was to use any kind of data and making something meaningful out of them. As we were all music lovers, we decided to make a live dataviz using facebook and echonest API to collect data and deliver them to the user so he could compare himself with his friends.

Music through data

img01
# #
02.

Visual Identity

We wanted the user to dive into music and data, and to make him familiar very fast with the UX. We simplified drastically the UI, and decided to alternate between a dark module, and a light module to bring dynamism throughout the navigation.

So, Profily.me is a single page experience and each module is full-height so you can switch through modules by scrolling.

Colour palette

To easily switch beetween modules, we wanted colours that match on both light and dark background. The red one does de job perfectly, so is the green you’ll see above.

Profily.me colour palette

  • img01
    #2F2F2F
  • img02
    #EE5355
  • img03
    #E6E5E5
  • img04
    #FFFFFF

Logo

The logo was the first part of the design made. The colour palette was thought wisely to match with the UI. I wanted an illustration part to be used separately if needed.

img04
03.

Focus on UI details

As we wanted a scrollable one-page , I chose a simple and easy way to navigate between each modules.

As a result, you can see that some part of the UI are common to each modules to help the used understand the idea.

Hover view of a selected area

img02

Sidebar menu & scroll between modules

img02
img02

We made 2 sidebars colours to perfectly match

with the background of the current module.

04.

Stats modules

For each module, we designed the specific chart that came along with the data we wanted to display. From a simple line chart, to a sexy radar chart, not to mention the dot chart, and the world chart.

Artist location module

img02
img02 img02 img02 img02

Genre comparison module

img02

Battle module

minutes of listens
this week

minutes of listens
this week

Danceability

Energy

Hotness

Tempo

Genre comparison details

img02
05.

Think social

Social is the heart of this music experience. We wanted to gather not only your own music stats, but all your friends as well, so you would be able to compare and compete with them. At each steps of your navigation, you can chose one or several friends picked in your facebook friend list.

Search for a fb friend

Click them!

  • Barbara Jeandeau

    9 playlists published

  • Loïc Padowski

    8 playlists published

  • Loïc Saint-Roch

    6 playlists published

  • Helen Pruvot

    9 playlists published

  • Lucie Reitz

    9 playlists published

  • Yves Do

    9 playlists published

06.

The result

Because a picture speaks a thousand words… Scroll down in the browser if you want to see more.

img02
img02

Thanks for scrolling this far

Hope you liked what you saw

For more informations, do not hesitate to reach out to me.

Switch to next project

Music Platform